|
|
back
MENU
|
|
Private
|

Efficiency
Efficiency
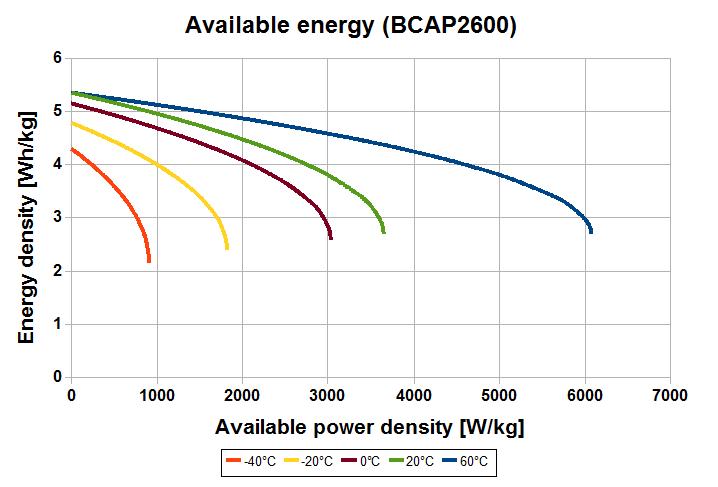
The experimental measurements have been performed at the University of Belfort on BCAP2600 supercapacitor, measuring the discharge time with a 200 W constant power. The Ragone plot curves have been obtained with the equation developped in the section "Constante power discharge" which depends only on Rs and C.
The following picture shows the BCAP2600 Ragone plot for different temperatures: -40C, -20C, 0C, 20C and 60C.

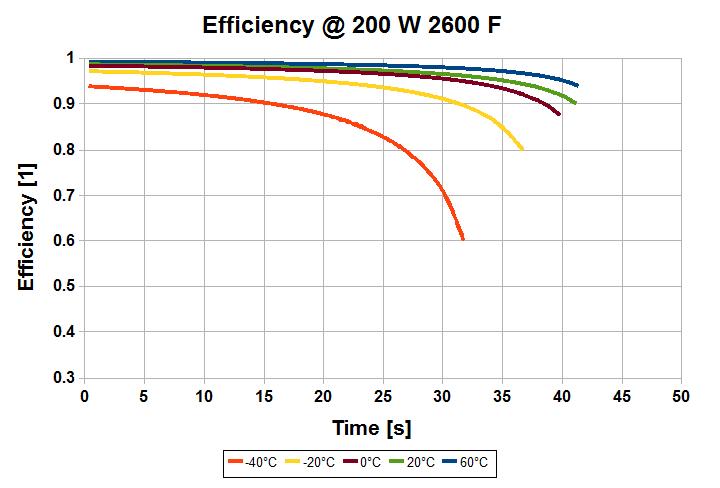
The efficiency is calculated with the capacitance and series resistance parameters which are deduced from the discharge curve. The curves are interrupted when the voltage at the supercapacitor terminals reach 1 V. The correlation of the time to discharge to 1 V with the experimental curves good.
It's straightforward that as the voltage drops during the discharge the efficiency drops too.
This is of course due to the increase of the current which compensates the voltage drop in order
to maintain a constant power in the load. The consequence is that the power remains constant
when the losses increase with the square of the current.

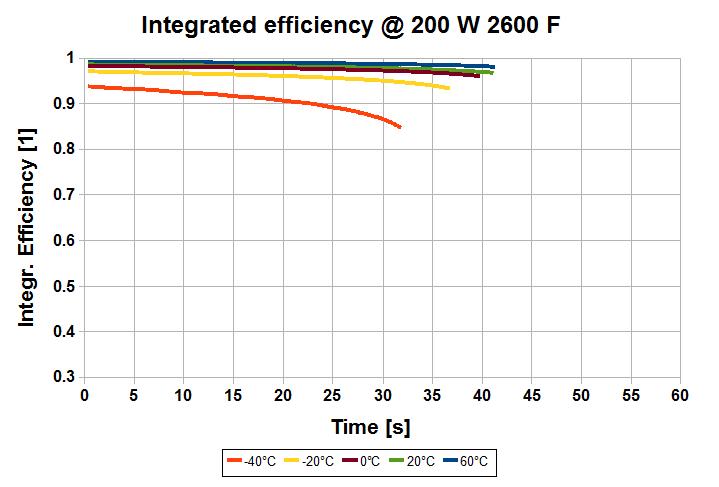
By integration of the losses over the discharge time, it is possible to obtain the resulting efficiency over a period t of the component. The total work in the load is equal to the product of the power by the time. The plots below represents the resulting efficiency at time t of the BCAP2600 for different temperatures.

Source: Garmanage: Roland Gallay