
|
|
back |
|
Private
|

Ragone
The Ragone plot concept is based on the fact that the electrical current charging or discharging an electrical storage system has to flow through both its proper internal resistance and the load or generator resistance. The two resistances are connected in series as illustrated in figure 1.
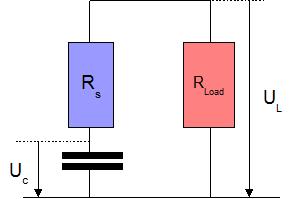
The resistance Rs is an equivalent resistance which is the result of a complex combination of series and parallel contributions due to the geometric structure of the capacitor. The electrode are very wide and all the elementary areas don't contribute to the resistance in the same way. The length of the current paths aren't the same for all parallel areas. Therefore a parallel construction must be taken into account. For each of these surface areas the electrical current flows firstly through the ohmic resistances of the electrode, the collector and the connections and secondly through the ionic resistance of the electrolyte between the two capacitances. All these contributions are connected in series.
Uc is a theoretical value for the internal voltage on the capacitance which is inaccessible for measurement. This is a value which may be different as a function of the position on the surface electrode. UL is the voltage at the physical terminals of the storage device. This simple model has the same validity for batteries, capacitors an supercapacitors: only the amplitude of the internal resistance differs from one component type to the other. Batteries have a resistance which is about ten time bigger than that of supercapacitors, which is again 10 times bigger than that of capacitors.
The series resistance is in most power applications the origin of sizing limitations of the storage device. On one hand the heat generated by the ohmic losses increases the component temperature to unacceptable values, and on the other hand the voltage drop at the component terminals becomes too important.
The following development is elaborated with the intention to determine the efficiency of capacitive storage components. The first step is a calculation of the energies involved in the system. These values will then be expressed as a function of the maximum stored energy and the maximum available power and will be plotted in a Ragone plot.
With the assumptions that Uc
is uniform on the electrode surface, that C and Rs
are independent of the current, in other words, independent of the
frequency, which is true only at very low frequency (f << 1/o),
the following basic relations UL = RL i and UL = uc – Rs
i may be combined to give
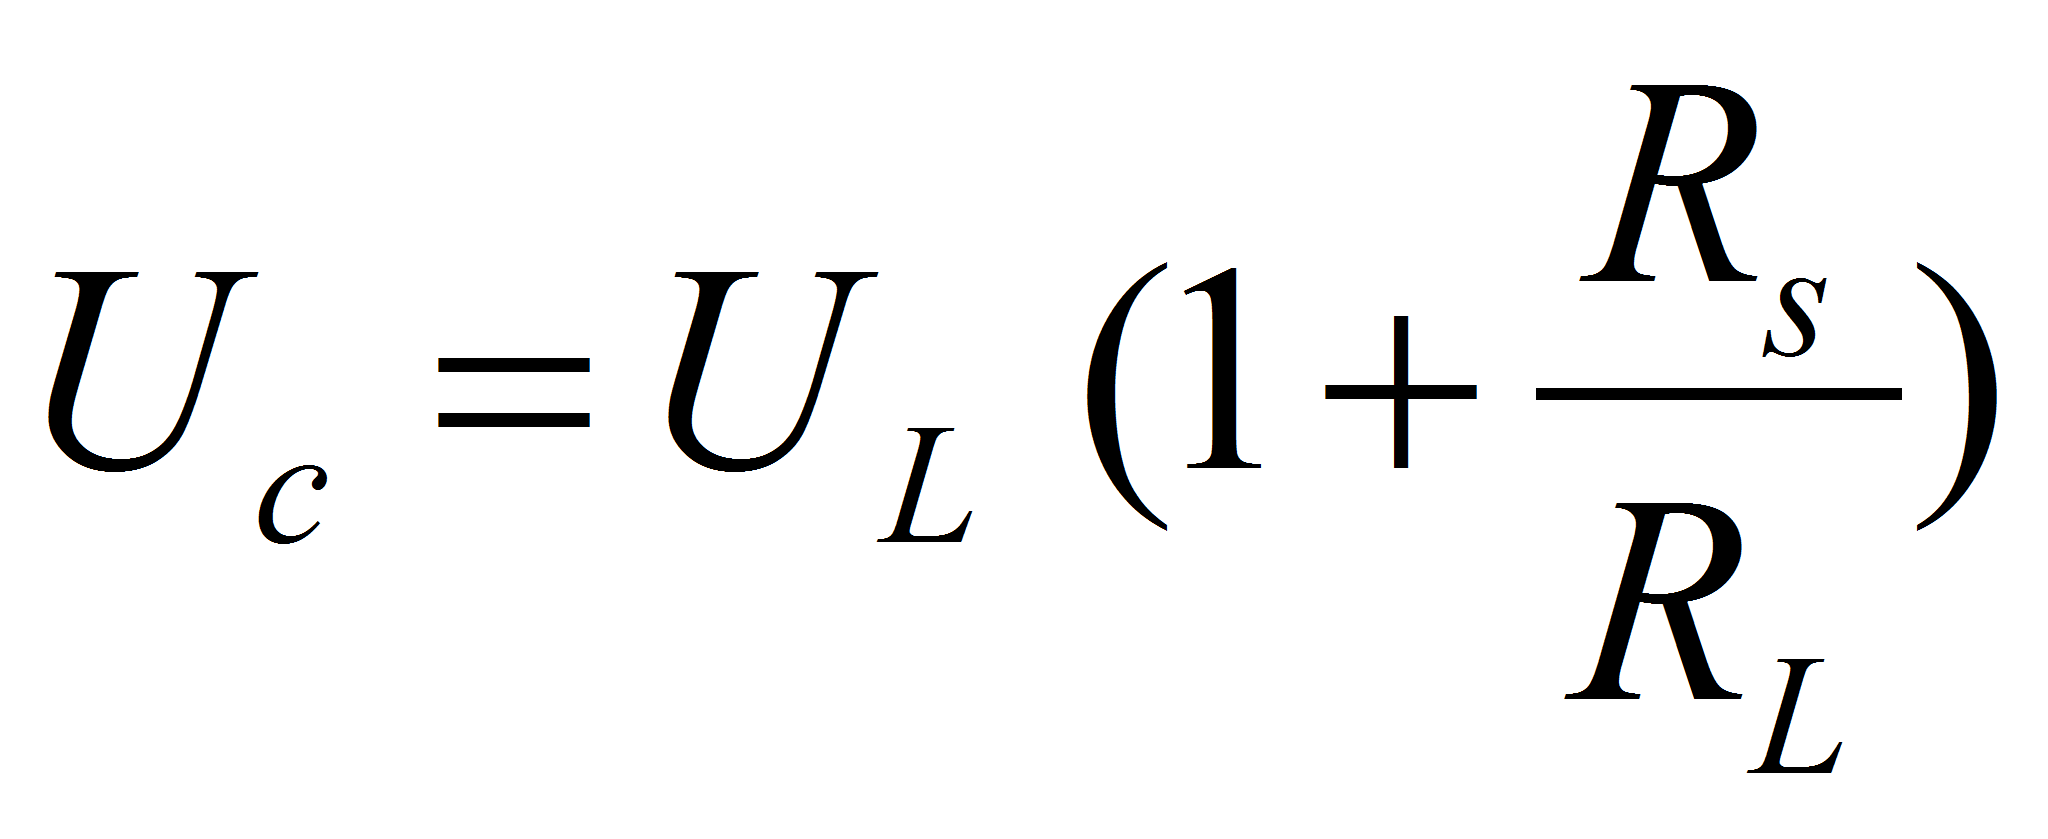
We need to distinguish different energy terms. In the case of a discharge, Wmax is the maximum energy stored in the electrical storage component
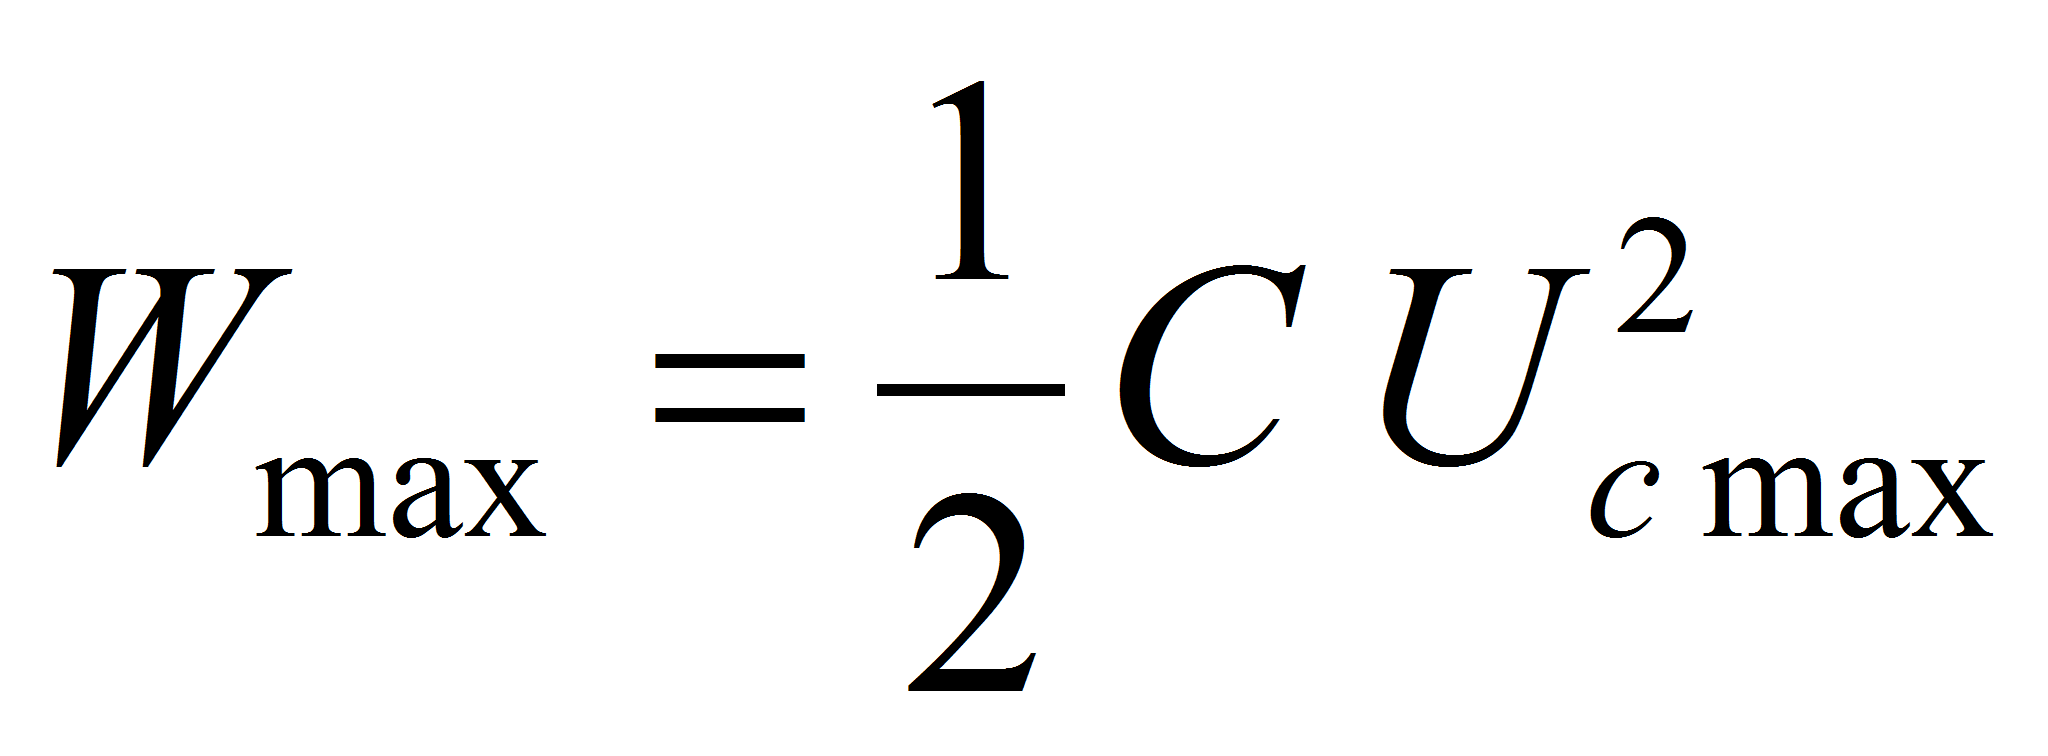
WL is the energy which is available for the supply of the Load

Ws is the energy which is dissipated in heat in the resistance of the storage component.

It may be observed that both WL and Ws depend on the current intensity, but that their sum don't.

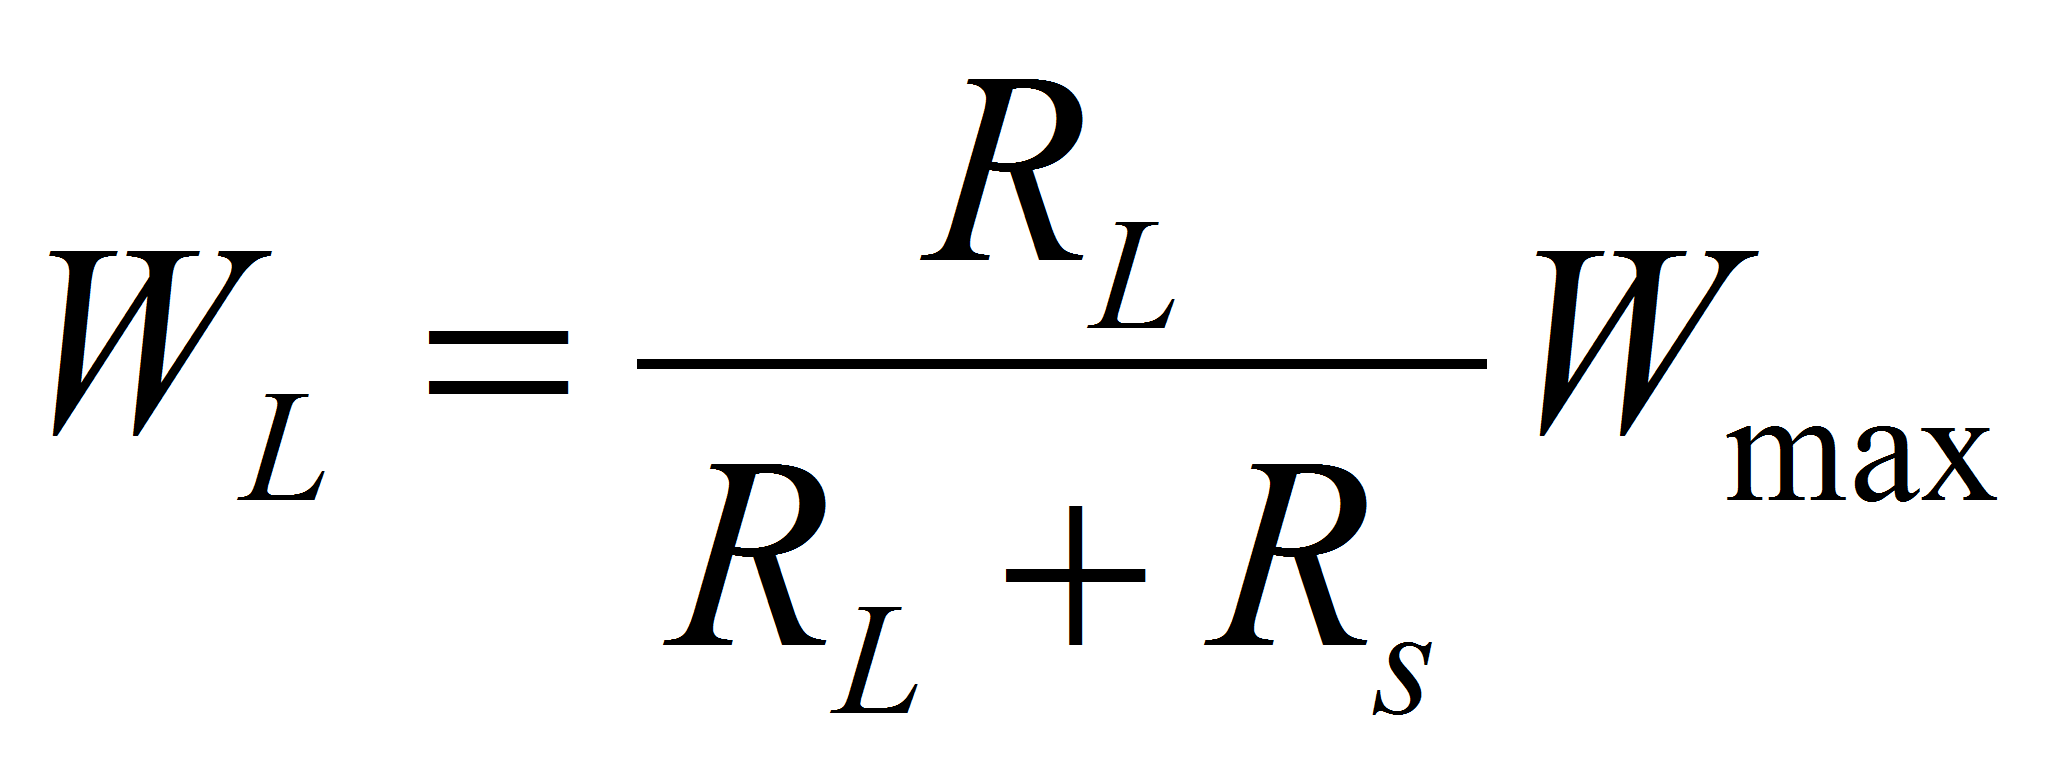
With the definition of the factor

The former relation may be written as
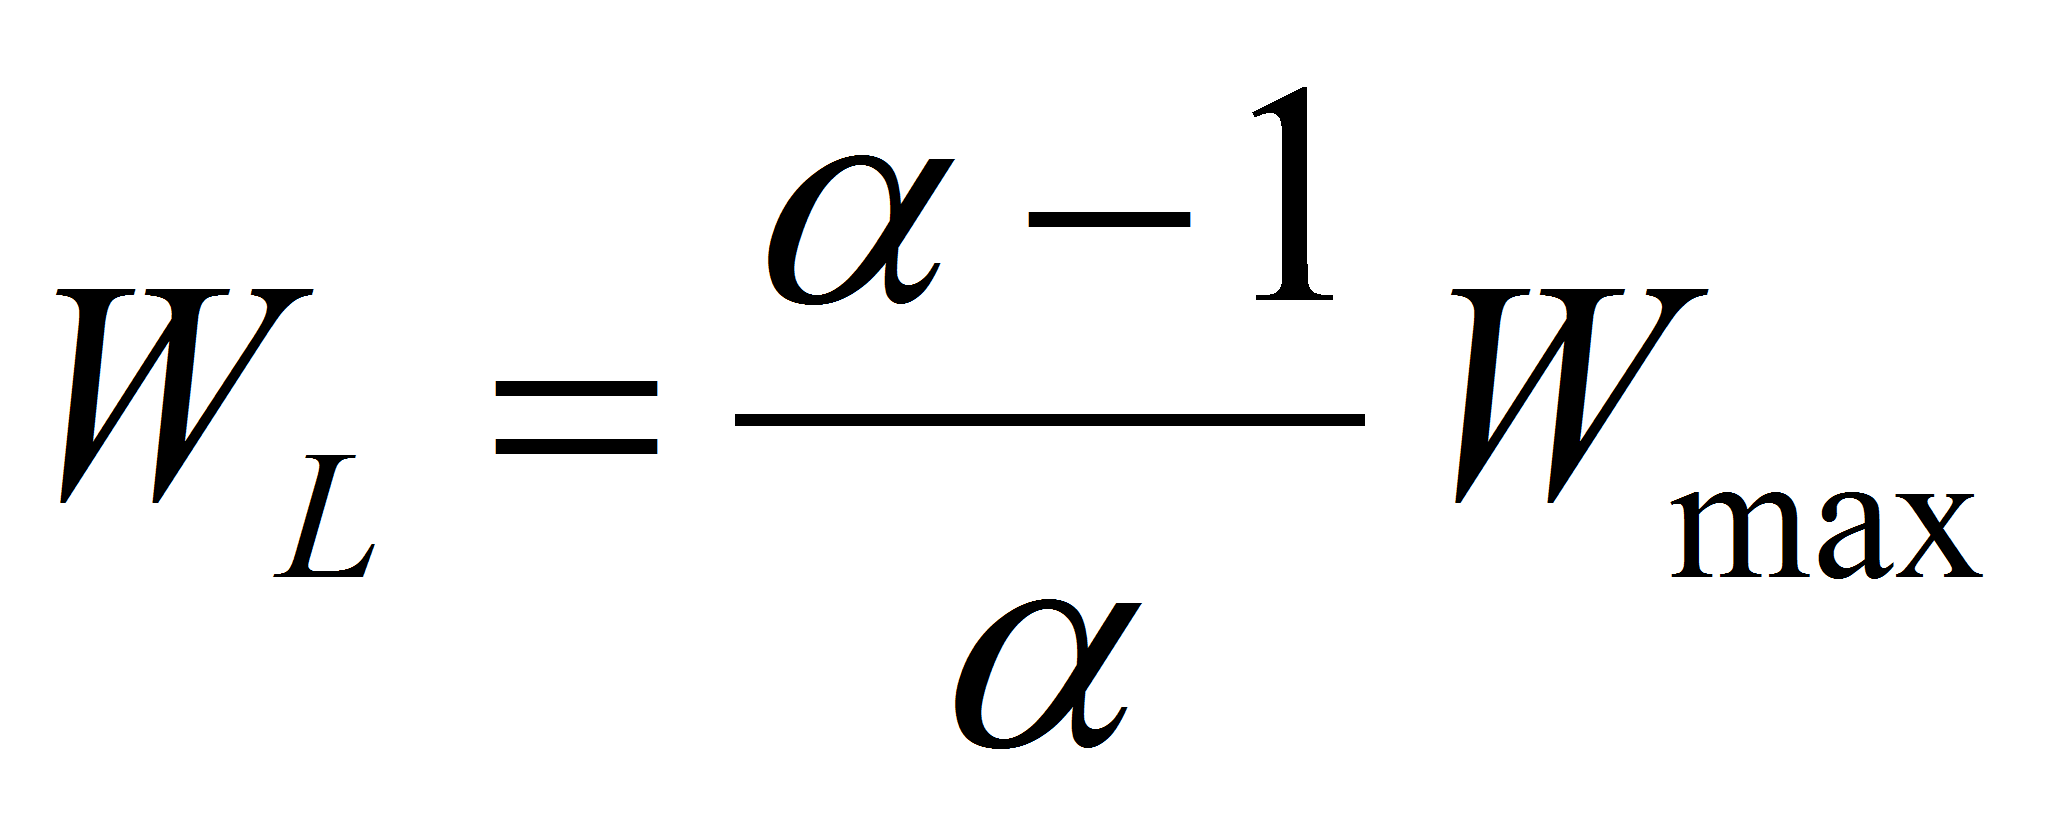
-> 1 : RL -> 0, max current, power remains in the capacitor
= 2 : match impedance
>> 2 : low current, low power
Match impedance
In the particular case of impedance matching when Rs = RL, the power available for the application Pm and the power dissipated in the internal resistance Ps are equal.

The voltage on the “pure” capacitance, or at the capacitor terminal when the current is very low, is the double of the voltage at the capacitor terminal at match impedance.<
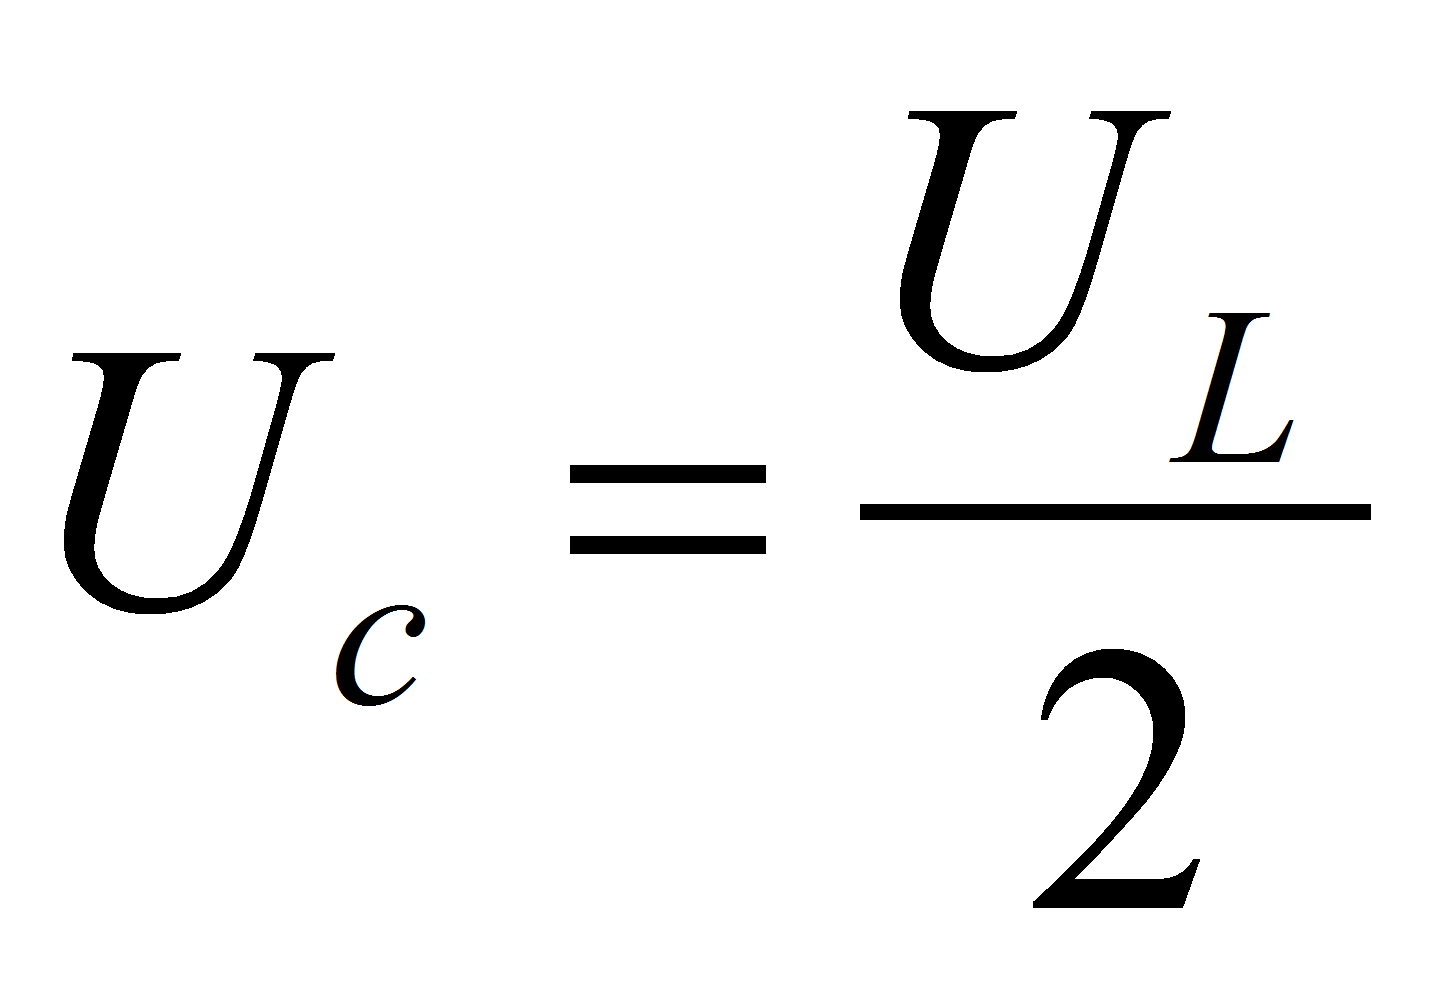
The power available at match impedance is therefore equal to:
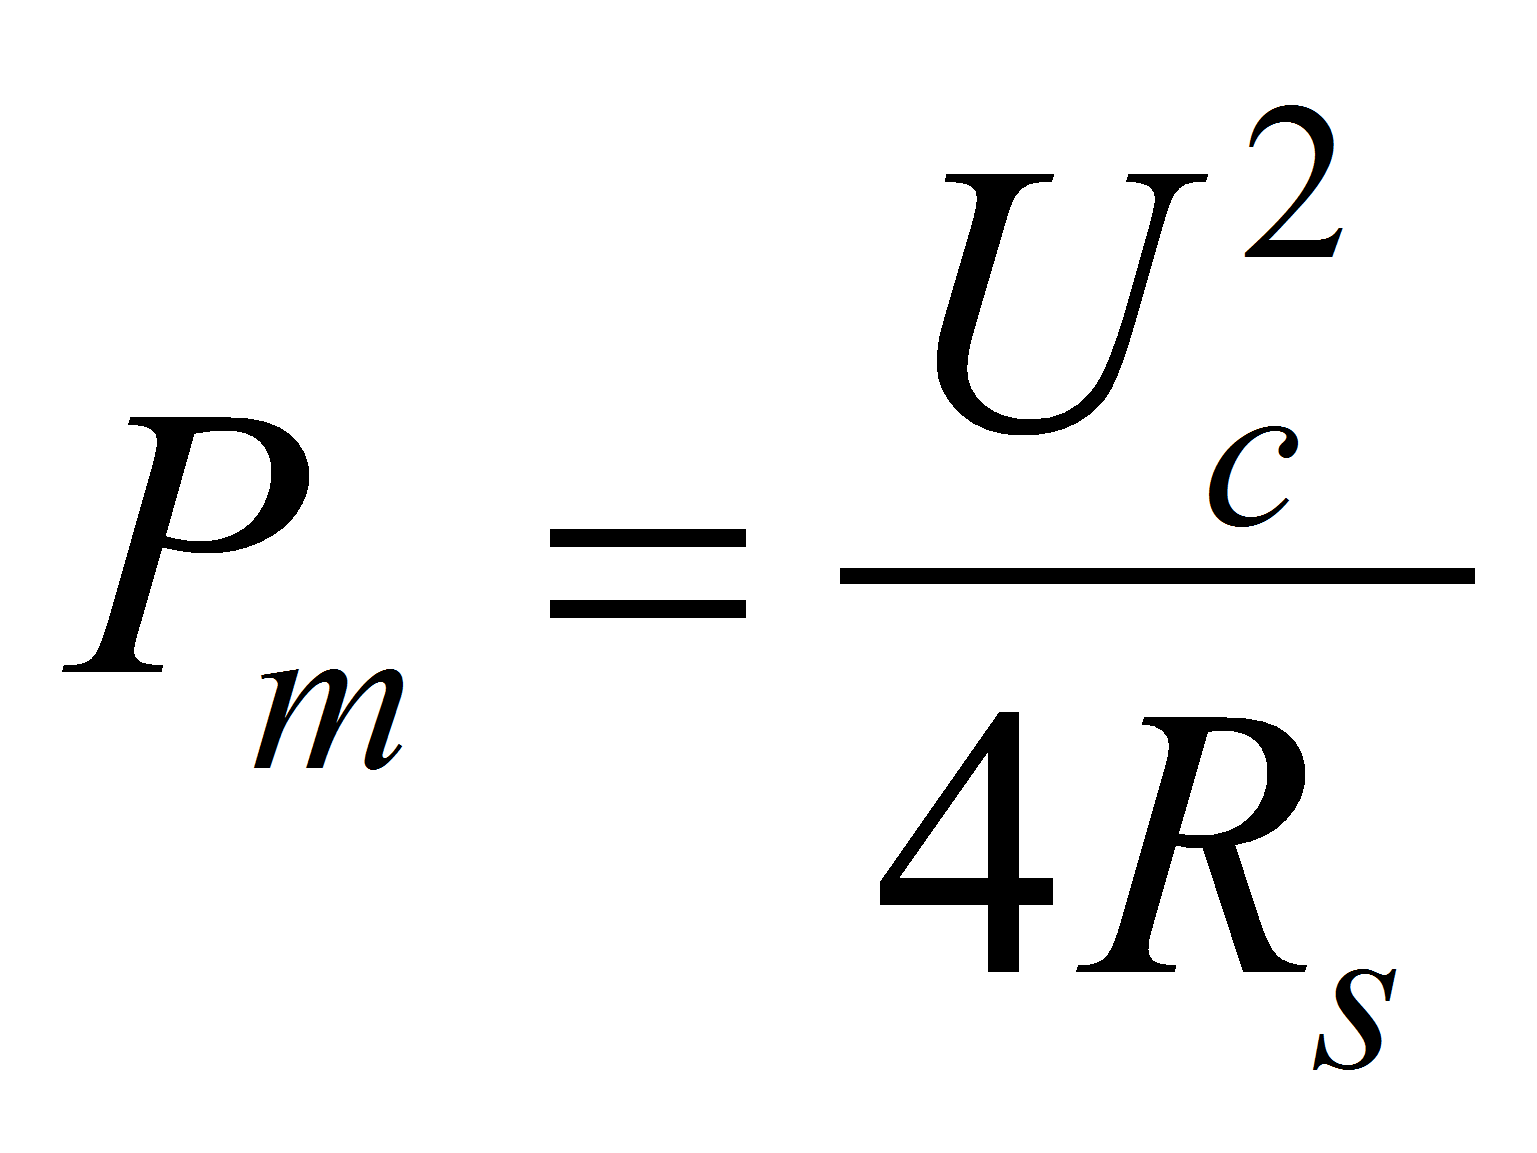
Pm is equal to a quarter of the maximum short power dissipated in the component when RL = 0. The capacitor manufacturers often do confusions between maximum and short power, and overestimate the power capability of their components.
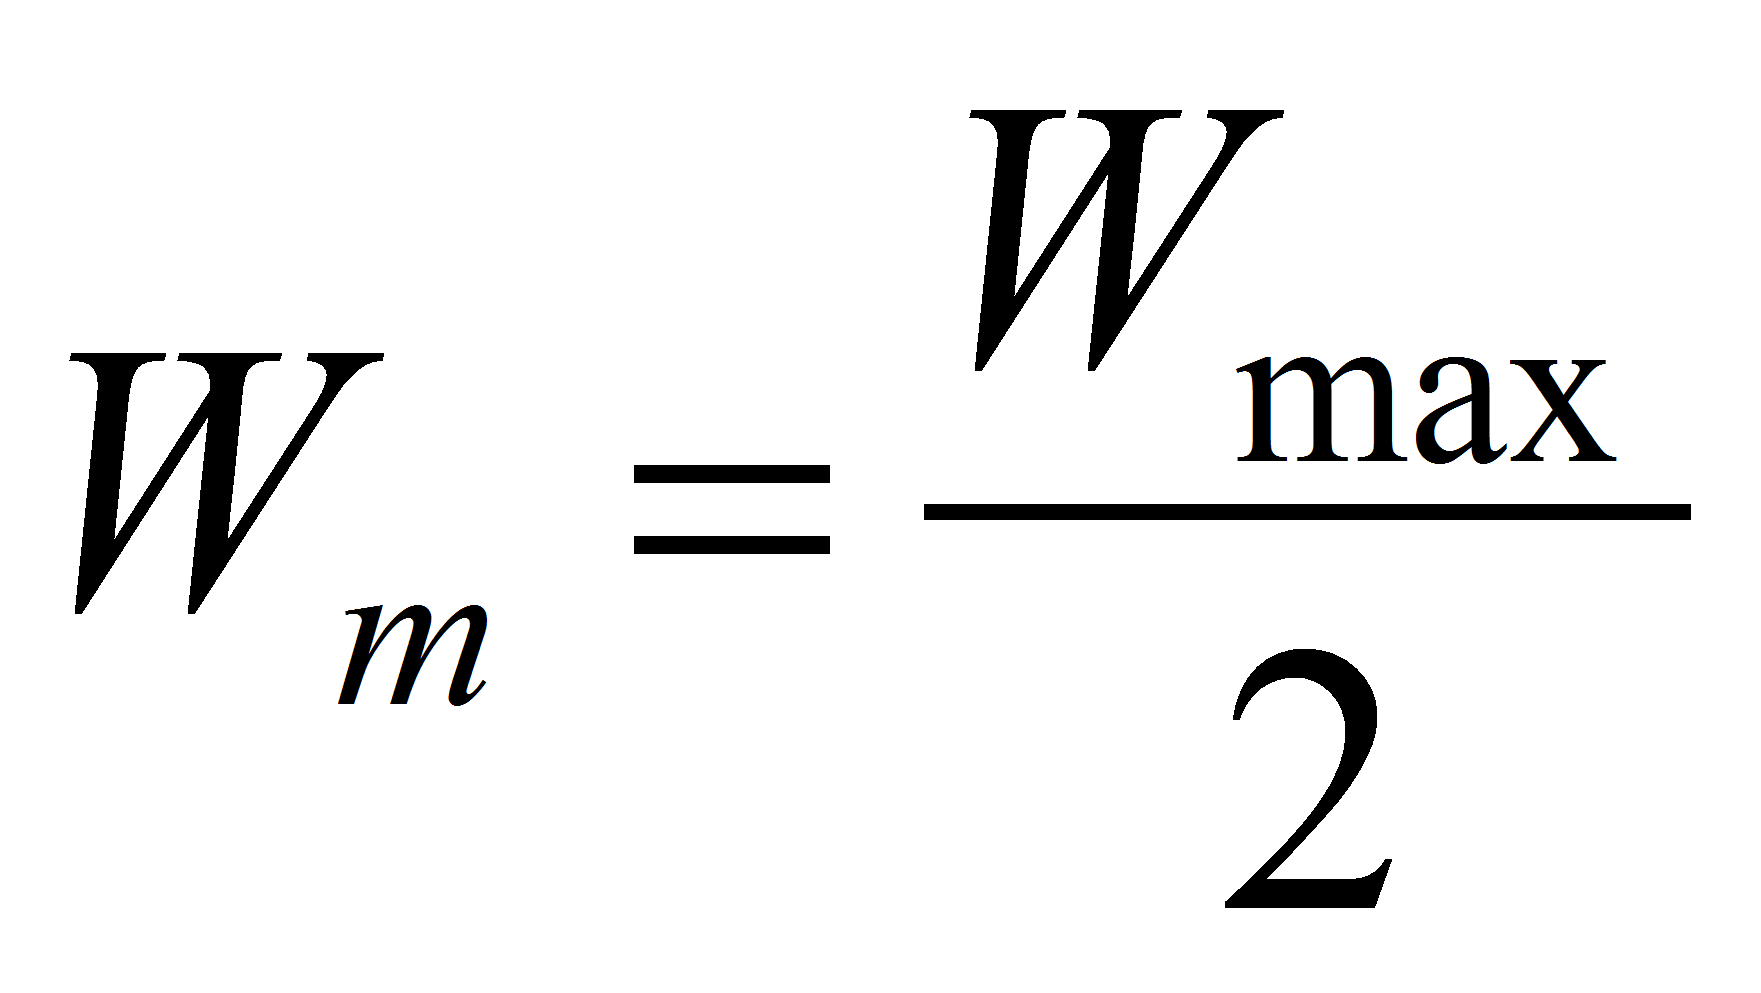
At match impedance the available energy is equal to half of the maximum stored energy:
Finally it's possible to find a relation between the maximum available power and the maximum stored energy

o = Rs C is the technology time constant or the time necessary to discharge the capacitor by a voltage factor “e” in a short. This time has a direct relation with the “cut-off frequency” observed on the capacitance curves as a function of the frequency (Fig. 3).
Power available for the load, Ragone equation
In the general case, in particular for the actual operation conditions

With the introduction of the efficiency defined as the ratio between the energy available for the load and the maximum stored energy in the component
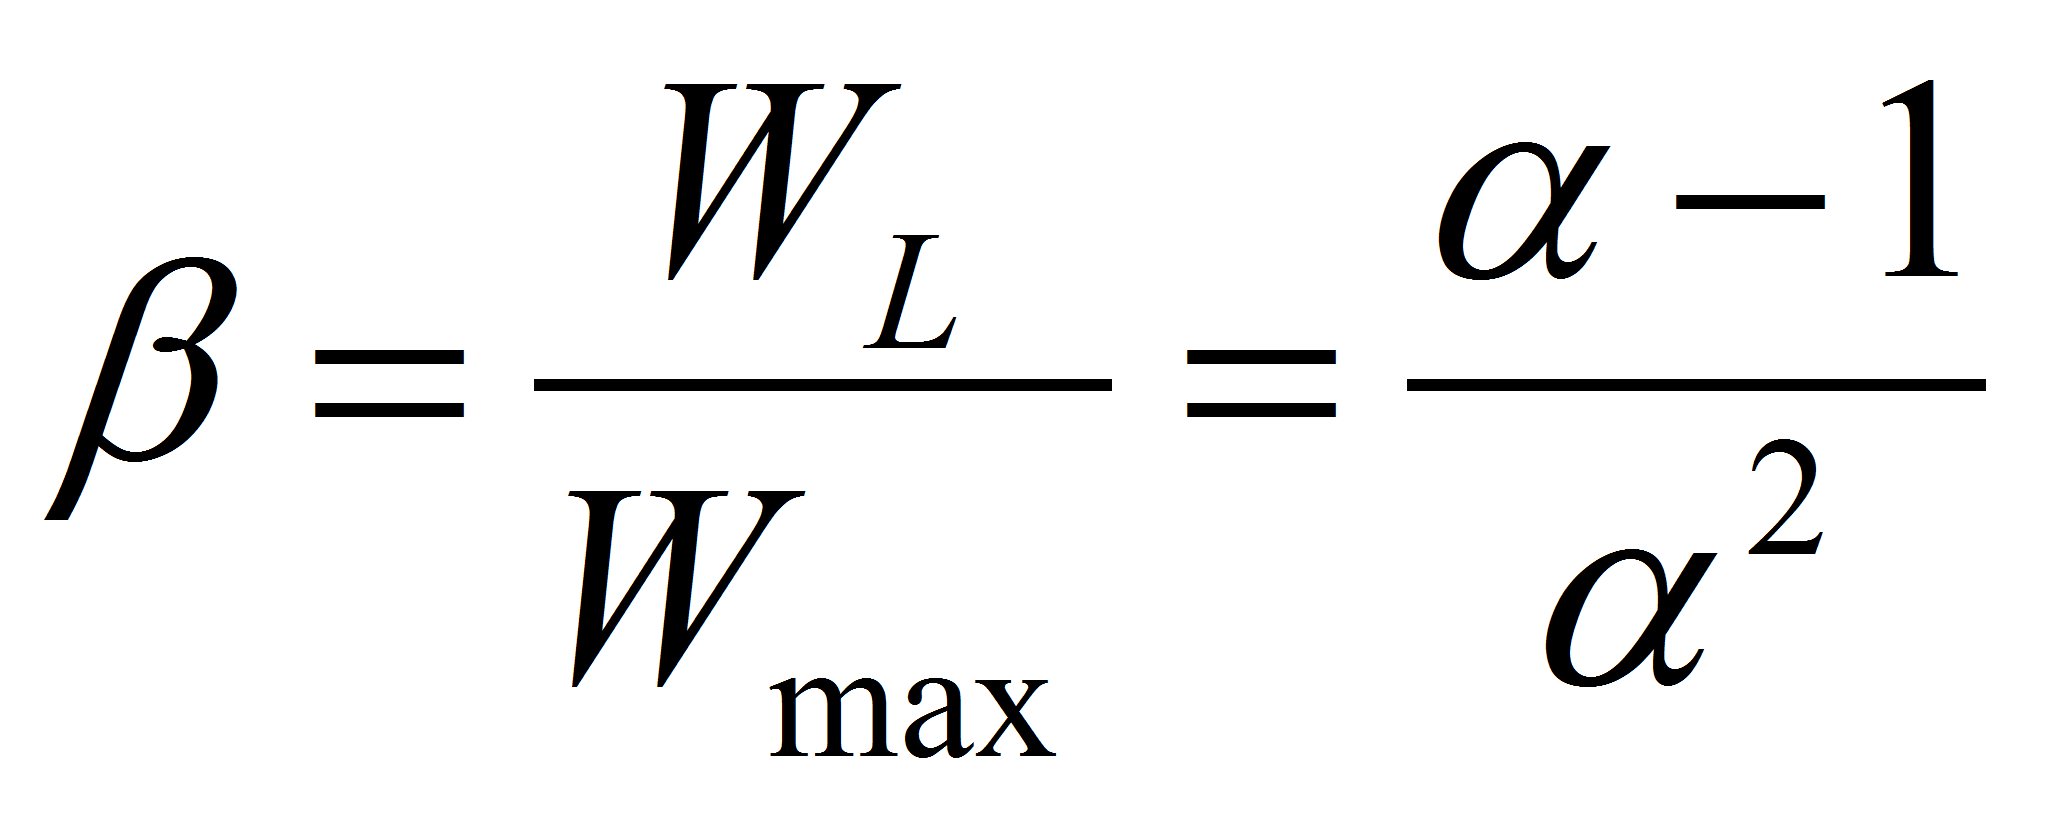
The power available in the load is now given as a function of the maximum power available at match impedance Pm by
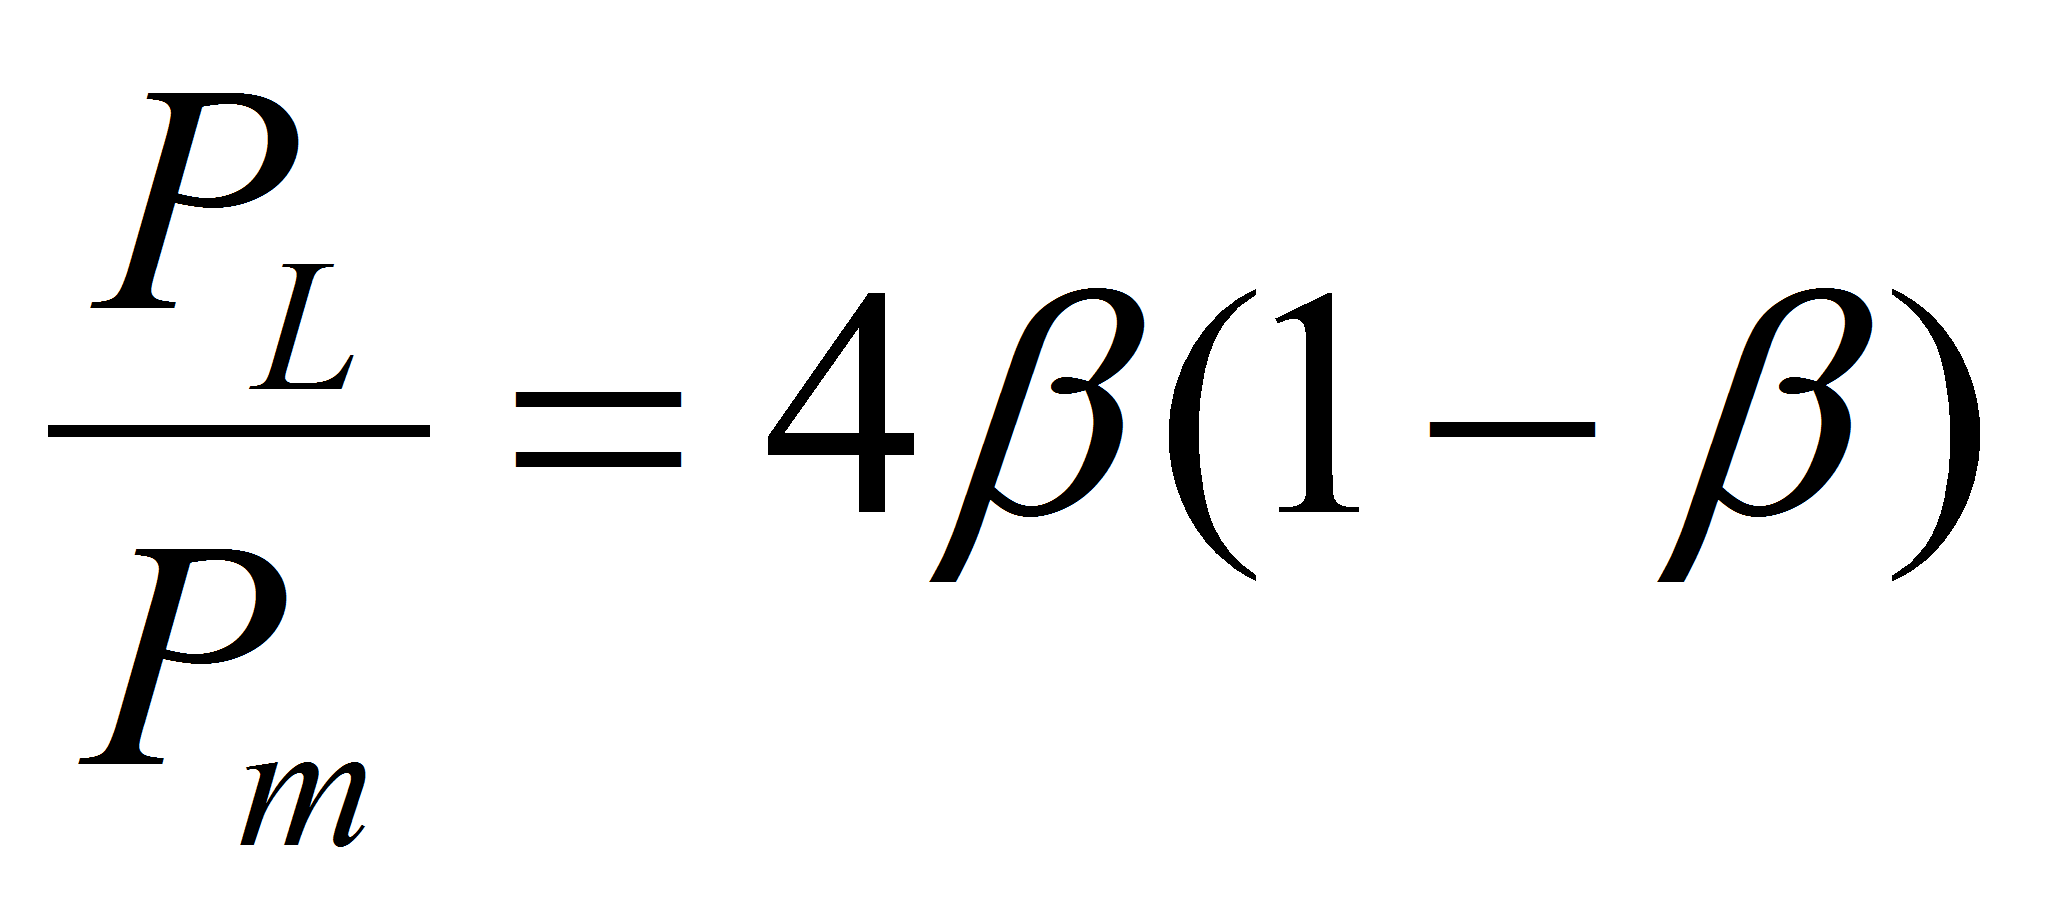
At match impedance the efficiency is equal to 0.5.
The resolution of this 2nd degree equation brings 2 solutions. A first “positive” one corresponds to the case where the load resistance is bigger than the internal resistance. This is the power regime in which the component is operated. WL may be plotted as a function of the power available in the load PL with the following relation:

with
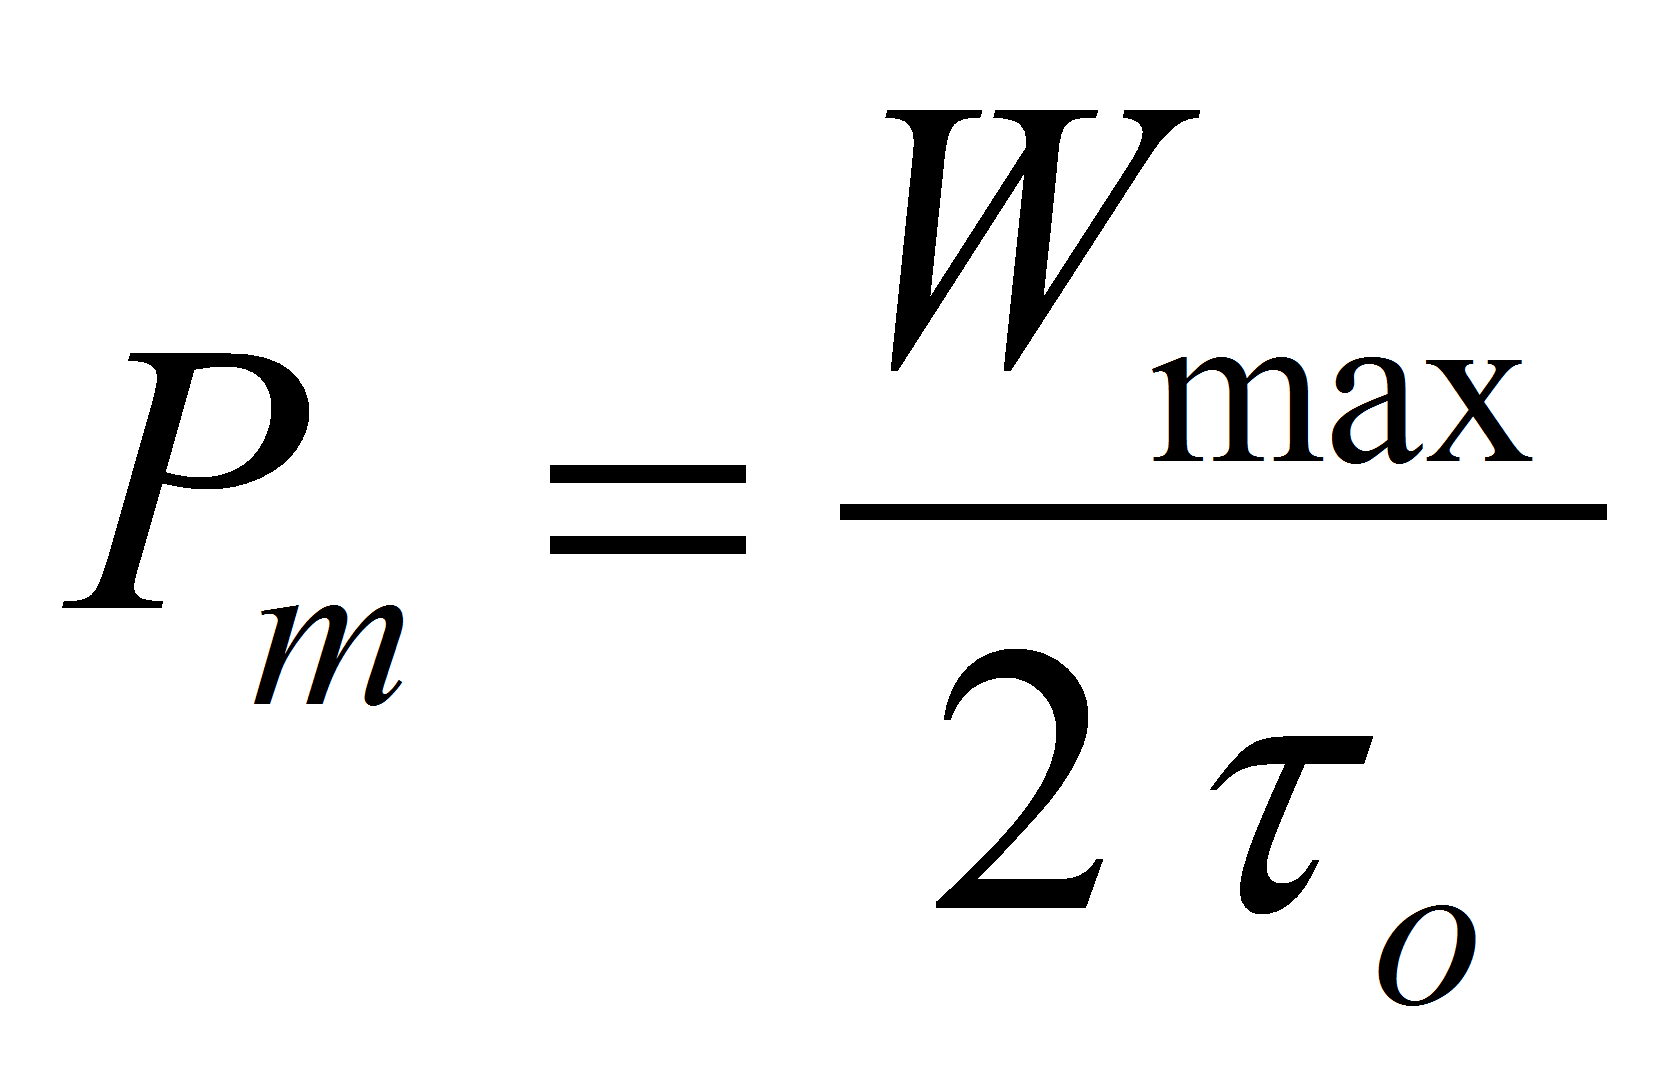
and
![]()
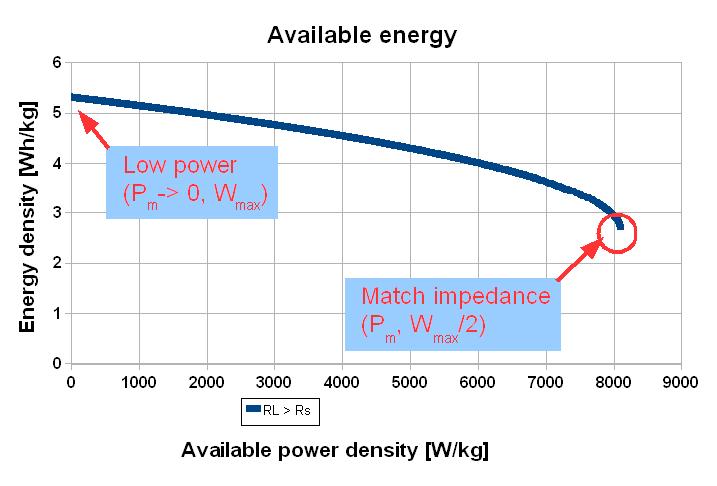
The stored energy can be transferred to the load with a good efficiency only with small currents. In that conditions, the Joule dissipation in the internal resistance of the component Ws is minimized.
At match impedance, exactly half of the energy is dissipated in the internal resistance.
The following charts are based on a typical carbon and organic electrolyte supercapacitor technology (300 F, 2 mOhm at 1 Hz). The typical time constant is o = 0.6 s.
A second solution is available for the case of a load resistance smaller than the internal resistance. The relation giving the available energy WL as a function of the power available in the load PL differs from the former one only by a minus sign before the square root. In this case almost all the energy is burnt in the internal resistance of the storage component, with the consequence of a fast heating. The extreme case is an electrical short of the component terminals.
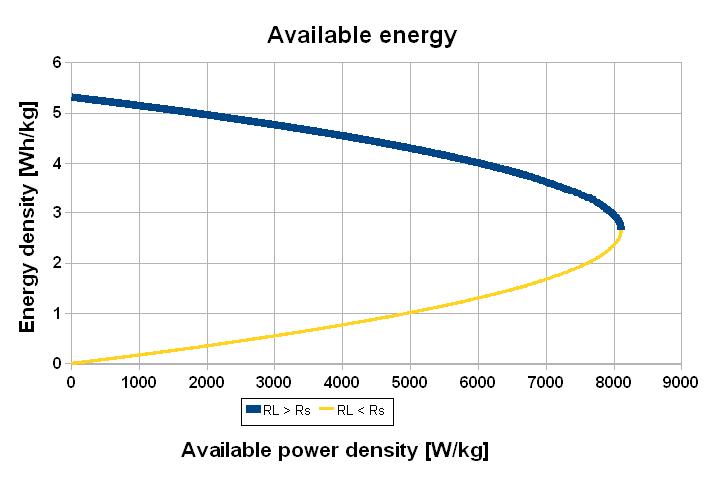
Sizing a storage system requires several informations: the available energy, the available power but also the power dissipated in the internal resistance of the component. Both powers are related by the efficiency factor. The following chart represents these powers and the total power.
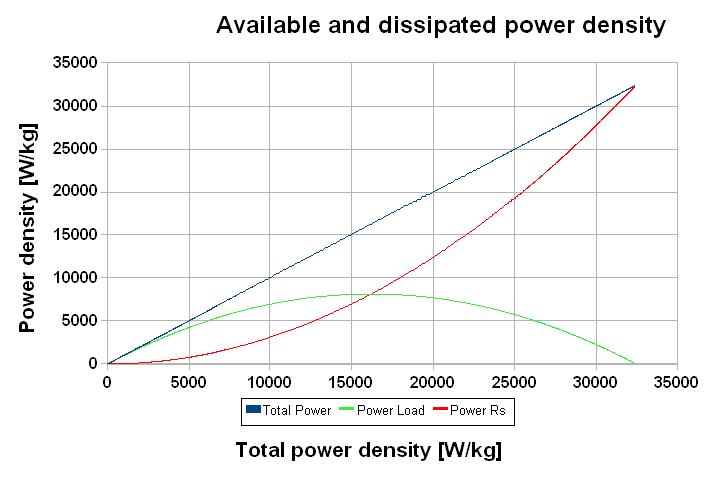
Interesting to observe is the fact that the available power for the load reach a maximum Pm at match impedance. It's therefore of no use to operate above this value (in the example Ptotal = 32 kW/kg and Pm = 16 kW/kg).
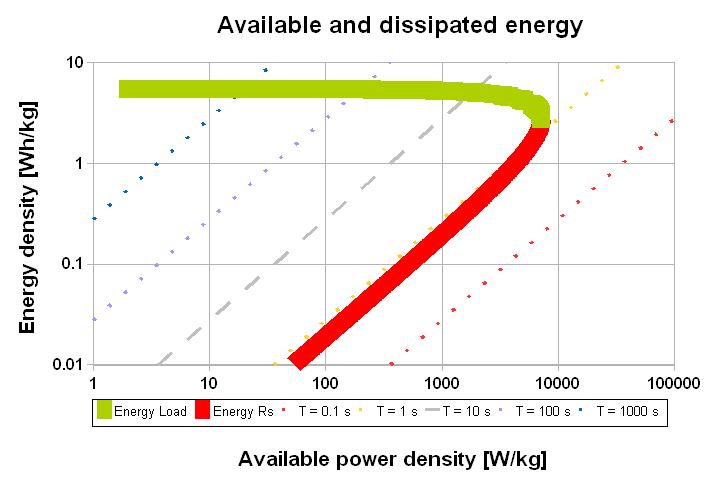
A classical chart is the log-log representation of the available energy as a function of the total power. This chart has the disadvantage not to inform about the actual available power.
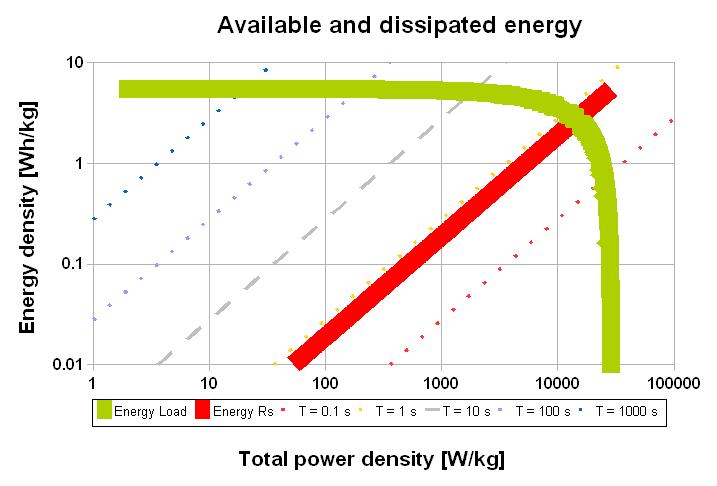
The dotted lines represent the conditions where the storage system has the same time constant (Energy/Power). The intersection of the two energies curves corresponds to the match impedance. At that point the time constant = 2o (in the example o = 0.6 s). The dissipated energy curve shows that at « low » power the efficiency is reversely proportional to the power.
In a second step we have to consider that some part of the electrode area
has not the same accessibility as others. The current path may be
longer in the electrolyte for different reasons. An important case
may be that some part of one electrode isn't well aligned with the
counter electrode. A more general one is simply because the ion path
is longer to reach the part of the electrode area which is close to
the collector.
This aspect may be simplified taking into account the frequency
dependency of the series resistance and of the capacitance. Both are
dropping with the frequency because the farther areas of the
electrode are no more accessible. Only the small time constant areas
are accessible leading to an apparent smaller time constant.
Consequently it's to expect that the Ragone plot drops also a bit
faster with the power, because the voltage decay is faster during a
discharge at high power.
Source: Garmanage: Roland Gallay